
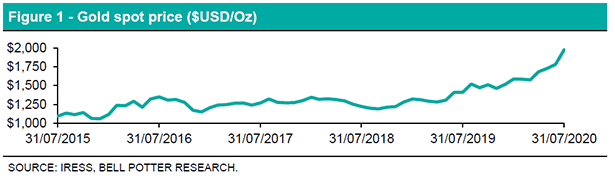
The gold spot price (per ounce) soared from ~US$1,780 to ~US$1,974 over July as second wave fears of COVID-19 remained the prevailing market narrative. Perth Mint Gold (ASX:PMGOLD) is a right to gold created by The Perth Mint, which gives investors the ability to purchase Government-backed gold. Statistically it accounts for over 90% of Australia and Asia’s gold production annually. This is equivalent to more than 10% of global gold production. However a recent investigation by The Australian Financial Review has revealed the historic mint repeatedly ignored staff concerns over supply chains resulting from small-scale gold miners in PNG, a practice thwart with environmental degradation and criticised for its use of child labour. Such allegations would be in breach of its global accreditation and internal policies.
ETFS Physical Gold (ASX:GOLD) is an alternative investment vehicle with a simple, cost-efficient and secure way to access gold by providing a return equivalent to the movements in the Australian dollar price of gold less a daily management fee. The securities are backed by physical allocated gold bullion held by JPMorgan Chase Bank, N.A (the Custodian). Only gold that conforms with the London Bullion Market Association’s (LBMA) rules for Good Delivery can be accepted by the custodian. Oversight of ethical, social and corporate governance criteria may help to better predict the future performance of ETFs and their constituent securities.
Geared funds
2 new geared ETFs began trading on the ASX in July. ETFS Ultra Long Nasdaq 100 Hedge Fund (LNAS) aims to provide investors with geared returns (before fees and expenses), that are positively related with and significantly magnified against the performance of the Nasdaq 100 Index. Meanwhile, ETFS Ultra Short Nasdaq 100 Hedge Fund (SNAS) aims to provide investors with geared returns (before fees and expenses), that are negatively related with, and significantly magnified against the performance of the Nasdaq 100 Index. The magnitude by which returns are generated from time to time may be greater than, or less than the movement in the index, depending primarily upon the degree leverage applied during the time in which returns are calculated (where leverage will be within the disclosed target range).
BetaShares NASDAQ 100 ETF Currency Hedged (HNDQ)
The investment objective of HNDQ is to provide an investment return that aims to track the performance of the Nasdaq 100 Currency Hedged AUD Index (the “index”), before taking into account fees and expenses.
Index objective
The Nasdaq 100 Currency Hedged AUD Index is designed to measure the performance of 100 of the largest Nasdaq listed non-financial companies, hedged back to the Australian dollar.
Investment approach
In seeking to achieve the investment objective, the Responsible Entity will employ a passive management approach with the aim of tracking the performance of the index, before fees and expenses. The fund currently obtains its investment exposure indirectly by investing in the Betashares Nasdaq 100 ETF (NDQ), being the unhedged version of the fund. The underlying fund will generally seek to invest in the securities that comprise the unhedged index in proportion to the weightings of the securities in the unhedged index. This is known as a full replication strategy. Eligible security types of index inclusion generally include American Depository Receipts (ADRs), common stock, ordinary shares, tracking stocks, shares of beneficial interest and limited partnership interests. The index is a modified market capitalisation-weighted index, which is rebalanced on a quarterly basis in March, June, September and December. Nasdaq selects constituents once annually in December. Each security must have a minimum average daily trading volume of 200,000 shares (measured over the three calendar months ending with the month that includes the re-constitution reference date). There is no market capitalisation eligibility criterion.
Domestic Equity ETFs
The recovery in domestic equities slowed over July as Victoria reported an influx of Coronavirus cases. This peaked on the 29th when the state recorded 723 new cases in the span of 24 hours. Accordingly, the All Ordinaries Accumulation and S&P ASX 200 Accumulation Indices returned 0.9% and 0.5% respectively. Small caps outperformed their large cap counterparts, with the S&P/ASX Small Ordinaries Accumulation Index returning 1.4%. On this note, K2 Asset Australian Small Cap Fund (KSM) was the top performing domestic focused ETF with a total return of 4.9%. KSM is an exchange traded managed fund which actively invests in small cap listed equities in Australia and New Zealand, seeking to deliver consistent absolute returns. Major contributing holdings for the fund included Netwealth (NWL) and NZ retirement provider Summerset (SUM) which rose 34% and 21% in the period.
BetaShares Australian Equities Strong Bear Hedge Fund (BBOZ) received the largest net fund inflows over the month with ~$66m. BBOZ was however, one of the poorer performing domestic ETFs, delivering investors with a return of -1.4%. The high level of net inflows is an indicator of diminishing bull market sentiment from investors. BBOZ is a geared fund which seeks to generate magnified returns that are negatively correlated to the Australian share market. The strategy aims to provide the return on a given day basis and due to the effects of rebalancing and compounding of investment returns, this may not be reflected in periods longer than a given day.
Total FUM declined over July predominantly due to net fund outflows from iShares Core S&P/ASX 200 ETF (IOZ) and SPDR S&P/ASX 200 Fund (STW). These were the main detractors from a possible all-time high, pulling a combined $286.4m out of domestic equity ETFs. This behaviour further cements the possible bearish outlook held on Australian equities. Both IOZ and STW seek to closely match, before fees and expenses, the returns of the S&P/ASX 200 Index. Hence investors are now seeking to move away large float-adjusted market cap stocks, instead finding new-found reassurance in global equities, fixed interest and commodities.
Global Equity ETFs
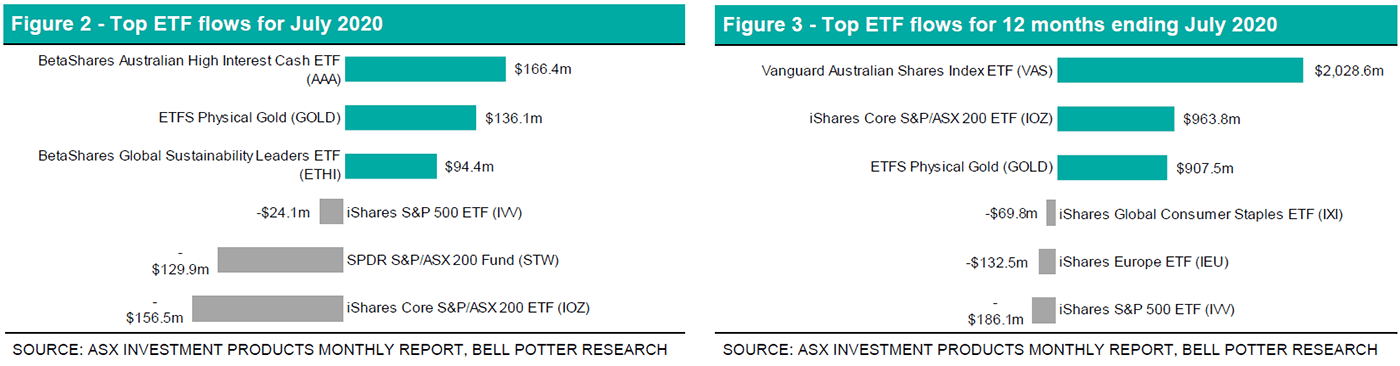
Net inflows of ~$620m into global equity ETFs were recorded in July, as the total FUM approached January 2020’s month-end high. BetaShares Global Sustainability Leaders ETF (ETHI) recorded the highest net inflows with ~$94m. ETHI aims to track the performance of the Nasdaq Future Global Sustainability Leaders Index before fees and expenses. The fund will generally invest in a portfolio of global equity securities that comprise the index and with similar proportionate weights. The index employs negative screens designed to exclude companies materially engaged in activities deemed inconsistent with responsible investment considerations; such as fossil fuels, gambling, tobacco and armaments. On the other hand, positive screens aim to provide exposure to companies that show a commitment to ethical principles and a responsible way of operating.
The top performing ETF for the month was BetaShares Global Gold Miners ETF Currency Hedged ($A) (MNRS), returning 18.6%. MNRS aims to replicate the performance of the NASDAQ Global Ex-Australia Gold Miners Hedged AUD Index. MNRS provides investors with diversification benefits, enabling them to spread risk beyond the relatively small Australian gold mining sector. For instance, Australia comprised just 4.9% of the fund’s country allocation as at 31 July 2020. Canada and South America accounted for the bulk of this, with country allocation weights of 49.1% and 14.3% respectively. MNRS also offers defensive benefits as gold miners’ fortunes are closely linked to the price of gold.
BlackRock products led the global net outflows with iShares S&P 500 ETF (IVV) recording net outflows of ~$24m for the month. IVV seeks to track the performance of the S&P 500 Index before fees and expenses. The index is designed to measure the performance of large capitalisation US equities. Thus, it is heavily weighted towards Information Technology and Healthcare. Top underlying holdings for 31 July included Silicon Valley’s Apple, Alphabet (Google) and Facebook. The Australian dollar hedged equivalent iShares S&P 500 AUD Hedged ETF (IHVV) also experienced net outflows of ~$14m.
Fixed Interest ETFs
Domestic fixed interest ETFs continued to strengthen, albeit diminishing from the previous month, with net inflows of ~$392m. This was predominantly led by BetaShares Australian High Interest Cash ETF (AAA), which recorded net inflows of ~$166m. AAA aims to provide exposure to Australian cash deposits with attractive monthly income distributions that exceed the 30 day Bank Bill Swap Rate (BBSW) after fees and expenses. The interest rate earned on the fund’s bank deposits, net of management costs, was 0.64% p.a. as at 21 August 2020. AAA provides investors with monthly distributions. The fund generated a distribution yield of 1.1% as at 31 July 2020 (calculated using trailing 12 month ex-dividends).
Global fixed interest ETFs also bolstered over July, recording net inflows of ~$64m.
Commodity & Currency ETFs
Following consecutive monthly decreases, commodity net inflows rebounded in July to ~$211m. ETFS Physical Gold (GOLD) and Betashares Gold Bullion ETF Currency Hedged ($A) (QAU) received the majority of net inflows with ~$136m and ~$41m respectively. The demand for commodity exposure continues to rise in light of unprecedented quantitative easing on a global scale. ETFS Physical Silver (ETPMAG) was the highest performer, delivering a monthly return of 29.4%. One year returns now stand at 39.7%. ETPMAG is backed by physical allocated silver held by JP Morgan Chase Bank, N.A. Only silver that conforms with the London Bullion Market Association’s (LBMA) rules for Good Delivery can be accepted by the Custodian. No new securities can be issued until the bullion is delivered to the Custodian. Each security represents an effective entitlement to silver, which changes daily to reflect the accrual of the fund’s management fee (0.49% p.a. as at 31 July 2020).