
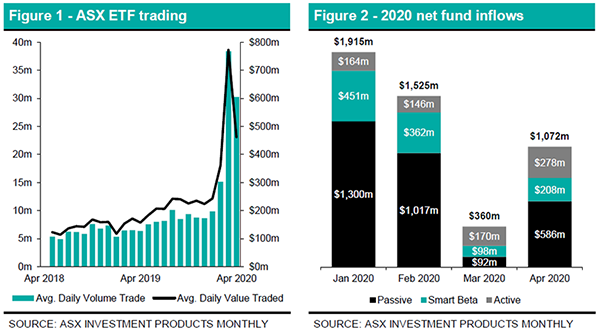
ETF trading has increased significantly over the past 3 months, with average daily value traded in March and April exceeding $770m and $460m, respectively. Despite the sell-off that has occurred in 2020, funds have stayed in the ETFs with each month recording positive net inflows. There are a variety of ETFs that can assist investors gaining exposure to a range of investment classes to diversify and assist stability to portfolios during periods of high volatility.
Active ETFs have experienced an increase in demand in comparison to the more widely used Passive and Smart Beta (factor-based) ETFs. Despite being less than 10% of the total ASX ETF fund size, Active ETFs recorded the highest net inflows in March. Net inflows here have been into BetaShares ETFs that provide downside protection (BBOZ, BEAR & BBUS), as well as the Magellan funds (MGE, MHG & MICH) that provide investors exposure to a high quality global asset manager.
BetaShares Global Government Bond 20+ Year ETF – Currency Hedged (GGOV)
GGOV aims to track the performance of the S&P G7 Sovereign Duration-Capped 20+ Year AUD Hedged Bond Index (before fees and expenses) that provides exposure to a portfolio of high-quality, long-dated, income-producing bonds issued by some of the largest developed economies in the world, hedged into AUD.
About the index
The Index measures the Australian dollar hedged performance of sovereign bonds with maturities greater than 20 years issued by G7 member countries for their domestic markets. To be eligible for inclusion in the Index, each security must meet the following eligibility criteria:
- be issued by the government of a G7 member country;
- be issued in the member country’s local currency in the respective domestic market;
- have a remaining term to maturity of more than 20 years.
Each security is weighted in the Index according to its market value with a duration related cap also applied at each reweighting period. No country will have a dollar duration contribution to the Index above 25%, although a country’s final market value weight in the Index may exceed 25%. The Index is rebalanced monthly, on the last business day of the month, based on selection of index components determined 4 business days before the rebalance date.
Domestic Equity ETFs
Domestic markets rebounded in April. The ASX All Ordinaries Accumulation Index and the S&P/ASX 200 Accumulation Index increased by 9.5% and 8.8%, respectively. Small caps outperformed the larger cap securities over the month with the S&P/ASX Small Ordinaries Accumulation Index returning 14.3%. The top performing market cap mandated domestic ETF was the Vanguard MSCI Australian Small Companies Index ETF (VSO) which holds approximately 170 securities with a median market cap of $2.1bn. VSO returned 16.5% in April.
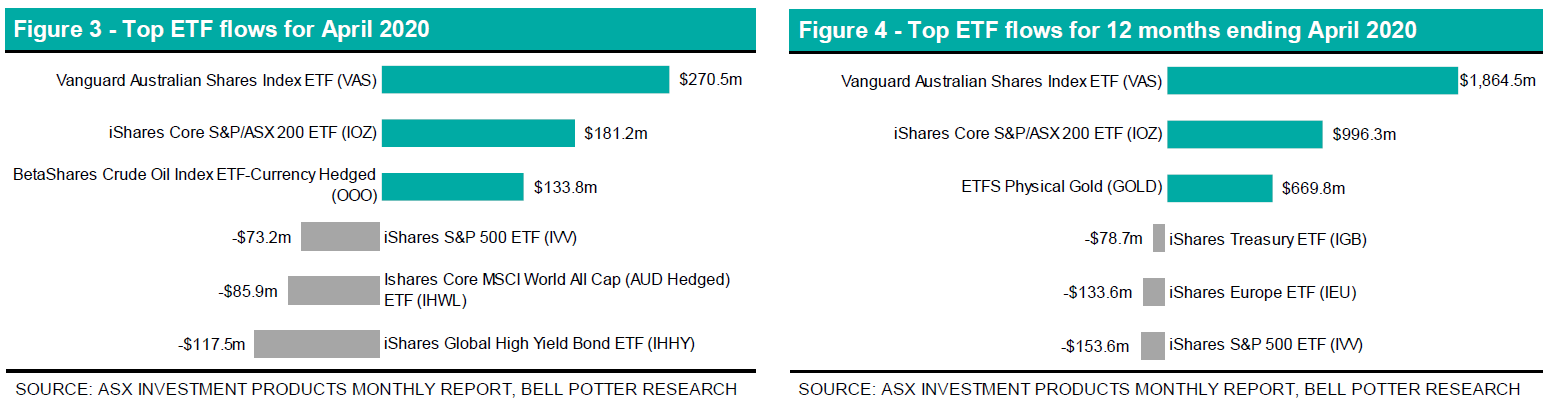
Vanguard Australian Shares Index ETF (VAS) and iShares Core S&P/ASX 200 ETF (IOZ) received the largest net fund inflows over the month with $271m and $181m, respectively. Whilst the total $723m net inflows into domestic equity ETFs were substantially below the $1.21bn in March 2020, it was the 3 third highest monthly total in the last 12 months.
BetaShares Australian Ex-20 Portfolio Diversifier ETF (EX20) led the net outflows with $37m coming out of the ETF, equating to a 27% reduction in the units outstanding. EX20 aims to track the performance of the Nasdaq Australia Completion Cap Index (before fees and expenses) comprising the 180 largest stocks listed on the ASX, ranked from number 21 to number 200, based on their market capitalisation. EX20 helps diversify away from the large ASX-listed banks and miners, with Financials having a weight of ~10% compared to ~35% in the ASX 20 and ~25% in the ASX 200.
Newly listed BetaShares S&P/ASX Australian Technology ETF (ATEC) was the top performing domestic focused ETF in April, returning 22.0%. ATEC aims to track the performance of the S&P/ASX All Technology Index (before fees and expenses). The Index provides exposure to leading ASX-listed companies in a range of tech-related market segments such as information technology, consumer electronics, online retail and medical technology.
Global Equity ETFs
Net flows were back in the positive for global focused ETFs, recording net inflows of $257m in April. iShares S&P 500 (AUD Hedged) ETF (IHVV) recorded net inflows of $119m which continued the trend of investors seeking protection from the fluctuations in currency movements. The inflow into IHVV corresponded with net outflows in iShares S&P 500 ETF (IVV) of $73m. Currency hedged ETFs help mitigate from the extreme volatility in currency movements, and helps investors gain exposure to a return that is more representative of the underlying securities. Despite the strong monthly performance, BetaShares U.S. Equities Strong Bear Hedge Fund – Currency Hedged (BBUS) recorded net inflows of $105m as investors continue to be weary of the outlook of the market and seek to obtain
downside protection. BBUS retuned -27.0% in April.
VanEck Vectors CSI 300 ETF (CETF) changed from tracking the CSI 300 Index to the FTSE China A50 Index, with a corresponding name change to VanEck Vectors FTSE China A50 ETF (CETF). The ETF had previously gained exposure as a feeder fund via a USlisted fund with the same mandate. The FTSE A50 Index is designed to represent the performance of the 50 largest companies by full market capitalisation in the mainland Chinese market. There is no change to the ongoing management costs.
The top two performing global focused ETFs were BetaShares Global Gold Miners ETF – Currency Hedged (MNRS) and VanEck Vectors Gold Miners ETF (GDX) which returned 36.8% and 29.5% respectively. Each provide an exposure to global gold mining companies. MNRS aims to track the performance of the Nasdaq Global ex-Australia Gold Miners Hedged AUD Index (before fees and expenses) that comprises the largest global gold mining companies (ex-Australia), hedged into Australian dollars. GDX seeks to provide investors with the investment returns before fees and other costs of the NYSE Arca Gold Miners Index (AUD). GDX is underweight South African securities compares to MNRS, 7.1% compared to 15.3%, and includes a weighting of approximately 13% towards Australian securities.
Fixed Interest ETFs
Domestic and global fixed income ETFs each recorded the second consecutive months of negative net flows with $14m and $105m, respectively. High interest cash ETFs were the main beneficiaries of net inflows for domestic focused fixed interest ETFs. BetaShares Australian High Interest Cash ETF (AAA) recorded net inflows of $72m for a mandated that seeks to provide exposure to Australian cash deposits, with monthly income distributions that exceed the 30 Bank Bill Swap Rate (BBSW) (after fees and expenses). iShares Global High Yield Bond (AUD Hedged) ETF (IHHY) experienced a decrease in the units outstanding of 68% over April, equating to approximately $118m of net outflows. IHHY has an average credit quality of BB- in the underlying holdings.
Commodity & Currency ETFs
Commodities again received strong net inflows, with $211m in April. BetaShares Crude Oil Index ETF – Currency Hedged (Synthetic) (OOO) increased the units outstanding by 585% over the month. The Bell Potter March 2020 ETF Report highlighted the risks associated with OOO, which during the month changed the investment mandate to add further protection from the volatility of the futures price of WTI crude oil. OOO has effectively become an actively managed fund during this period which should add further caution to potential investors seeking to gain exposure to a potential rebound in the price of oil. The futures exposure that OOO aims to provide to unitholders is now at the discretion of the fund provider until further notice. ETFS Physical Palladium (ETPMPD) returned -19.6% in April as a reduction in auto sales may have modestly contracted the demand for the precious metal. Gold continued to see strong net inflows as a hedge to the volatility in the global markets.