
Introducing Chi-X
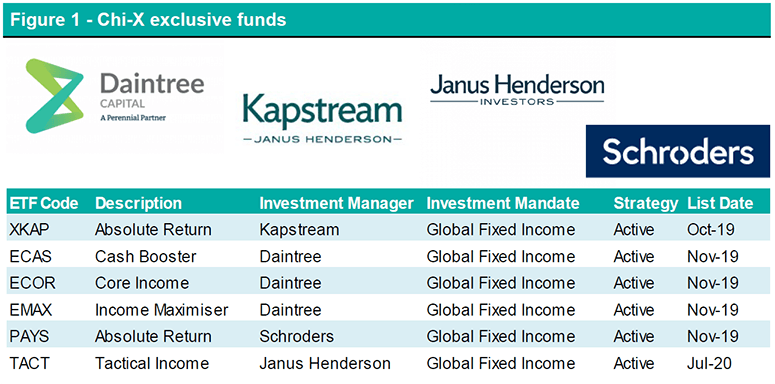
Chi-X Australia (CXA) was originally launched in 2011 as a competing secondary trading platform to the Australian Securities Exchange (ASX). The focus behind its conceptualisation was to provide more efficient and cost effective access to local and global investment opportunities, now boasting over 20% market share for all equity and ETF trades. While this remains a central part of business, CXA has since partnered with numerous issuers, launching a series of indices, warrants and funds. Magellan Financial Group (MFG) revealed plans in August to create a line of low fee actively managed ETFs. Furthermore the heavily anticipated MFG Core International Fund, MFG Core ESG (Environmental, Social, and Governance) Fund and MFG Core Infrastructure Fund are intended to be CXA exclusive products accessible at the end of this calendar year.
The following report now contains research on 222 Australian ETFs (216 ASX / 6 CXA).
VanEck Vectors Video Gaming and eSports ETF (ESPO)
ESPO is designed to capture the performance of the global Video Gaming & eSports sector by giving investors access to a diversified portfolio of the largest and most liquid companies involved in video game development, eSports and related hardware and software.
About the index
The MVIS Global Video Gaming & eSports Index is designed to track the overall performance of companies involved in video game development, eSports, and related hardware and software globally.
The index includes only the largest and most liquid listed companies that generate at least 50% of their revenues from video gaming and/or eSports. This may include companies whose business activity involves: the development of video games and related software and hardware; the provision of streaming services; or eSports events such as league operators, teams, distributors and platforms, and may include companies from developed, emerging and frontier markets. The index is a market capitalisation weighted index which applies a capping scheme of 8% to guarantee diversification and avoid overweighting. If a single stock exceeds this maximum weight, then the weight will be reduced to the maximum with the excess redistributed proportionally across all other index constituents. This process is repeated until no stocks have weights exceeding the respective maximum weight.
Components of the index are reviewed and rebalanced on a quarterly basis, usually at the close of the third Friday of March, June, September and December. Target coverage is at least 90% of the free-float adjusted market cap of the investable universe with a minimum of 25 companies for index inclusion. Minimum market cap for eligible index inclusion is USD $150m. If the coverage is still below 90% or the number of components in the index is still below 25, the largest remaining stocks will be selected until coverage of at least 90% is reached and the number of stocks equals 25. Additional companies may be added at discretion to achieve this.
VanEck Vectors Global Healthcare Leaders ETF (HLTH)
HLTH is designed to capture the performance of the global Health Care sector by giving investors access to a diversified portfolio of companies with an identified long-term trajectory of growth and capital appreciation.
About the index
The MarketGrader Developed Markets (ex-Australia) Health Care Index consists of 50 fundamentally sound companies which exhibit the best growth at a reasonable price (GARP) attributes in the Health Care sector from developed markets around the globe excluding Australia.
- 25 developed markets form the investible universe from which constituents may be selected. This includes, but is not limited to, the United States, United Kingdom, Spain, Japan, Hong Kong and New Zealand.
- Potential companies are then filtered and removed via an illiquidity screen. All companies must have a minimum market capitalisation of USD $500m and a minimum three month average daily trading value of USD $2m.
- Once the investable universe has been adequately narrowed, MarketGrader then employs its unique selection methodology. It calculates 24 fundamental indicators for every company within this new coverage universe across four broader categories being: Growth, Value, Profitability and Cash Flow. The 24 indicators are then aggregated into a single numeric score. On the rebalance selection date MarketGrader will identify the top 100 scoring companies. The Index is reconstituted and rebalanced on a semi-annual basis, usually at the close of the third Friday of March and September.
- The 50 largest companies by market capitalisation are then equally weighted to form the index.
Domestic Equity ETFs
With the announcement of the Federal Budget on October 6th and Victoria still operating well belong long-term economic output, domestic equities once again faced further bouts of uncertainty (as is the trend for this calendar year). We observed a similar pattern of net flows re-emerge to that likened back in March, with onshore ETFs becoming popular cost effective tools for navigating volatile markets. Net fund inflows were up tenfold month-on-month, with $1,126m circulating back into the space. iShares Core S&P/ASX 200 ETF (IOZ) was the conspicuous catalyst behind this increase, with the fund accounting for approximately $834m or 74% of the uplift. As evidenced by 1 month and 12 month flows; passive, accessible and unembellished ETFs such as IOZ, VAS and A200 appear to be the easy choice for investors depending on the scope of their investment horizon. IOZ for example seeks to replicate the performance of the S&P/ASX 200 Accumulation Index before fees and expenses.
Outside of high conviction bearish funds that obtain geared short exposure via futures contracts, the top performing ETF for the month was InvestSMART Ethical Share Fund (Managed Fund) (INES), which returned 3.3%. The ETF is optimised for investors seeking an actively managed, diversified pool of Australian companies that produce growing and sustainable profits at low risk of interruption from threats associated with ESG factors. INES may be further cementing the apparent shift in investment ideologies when it comes to a holistic assessment of companies and their fiduciary responsibilities. Quite remarkably, the fund has produced a return of 12.3% for the calendar year to date, outperforming domestic equity mandated peers by a clear and wide margin. While still relatively nuanced, we see the rise of ESG investing set to take off, as evidenced by strong outperformance of passive indices and rivals across this year’s March and September drawdowns. InvestSMART is the only issuer to offer an actively managed portfolio of undervalued growth opportunities that seeks to incorporate ethical disruption risk into the domestic equity selection process. While an interesting and attractive opportunity, we do however note that the size of the fund is currently sub-scale.
Global Equity ETFs
Global Equity mandated ETFs fared similar economic and geopolitical risks with an upcoming US election and further stimulation checks. With a reoccurring focus on quality and ethical standards for the month, BetaShares Global Sustainability Leaders ETF (ETHI) paved the way for international exposures with net fund inflows of $61m. Trailing closely behind in second and third was the VanEck Vectors MSCI World ex Australia Quality ETF (QUAL) and BetaShares NASDAQ 100 ETF (NDQ), with net fund inflows of $59m and $57m respectively. A similar trend emerges across the last 12 months, with all three funds receiving strong demand from investors.
Newcomers to both Bell Potter coverage and the Australian domiciled ETF suite, VanEck Vectors Video Gaming and eSports ETF (ESPO) and VanEck Vectors Global Healthcare Leaders ETF (HLTH), held their place among top performers for the month with returns of 5.4% and 3.2% respectively. A deeper insight into the index methodology and investment thesis of these two products can be found on pages 2 and 3.
With global tech stocks sliding over September, ETFS Ultra Short Nasdaq 100 Hedge Fund (SNAS) generated a monthly return of 12%. SNAS is a synthetically geared fund which seeks to provide investors with amplified returns that are inversely related to the Nasdaq 100 Index. Short exposure may fluctuate between a range of minus 200-275% of fund’s NAV depending on the degree of leverage applied. Thus, over a short interval of time, a 1% movement in the index will result in a 2-2.75% ROI for SNAS holders. As the strategy seeks to provide this return on a given day basis, this may not actually be reflected in periods longer than a given day due to the effects of rebalancing and compounding. SNAS is currency hedged, with the fund manager aiming to reduce, but not necessarily eliminate, exposure to movements in AUD/USD exchange rate. More recently we have observed a shift towards traditionally uncommon ETFs, as investors seek to hedge pre-existing long exposures, implement temporary changes in asset allocation and/or gain speculative positions.
Fixed Interest ETFs
Assumedly in the interest of generating real returns, investors exited cash equivalents en masse due to lower deposit rates. The BetaShares Australian High Interest Cash ETF (AAA) experienced net fund outflows of $215m. iShares Core Composite Bond ETF (IAF) on the other hand received further consistent demand from investors. IAF provides simple access to investment grade fixed income securities issued by the Australian Treasury, Australian semi-government, supranational and corporate entities. Investors seeking global income generating securities seemed to be equally risk averse, opting for the Vanguard International Fixed Interest Index (A$ Hedged) ETF (VIF). VIF provides access to a portfolio of diversified, global government debt that is relatively unaffected by currency fluctuations due to hedging.
Commodity & Currency ETFs
Commodities continued to cool, with relatively weaker net inflows of $81m recorded for the month. BetaShares unveiled in August a supplementary PDS in relation to their Crude Oil Index Currency Hedged ETF (Synthetic) (OOO). In light of unprecedented market conditions and by way of seeking to add further protection against the volatility of WTI crude oil futures, the fund had temporarily replaced its investment exposure to one-month contracts with three-months. OOO’s investment exposure has since reverted to front-month WTI crude oil futures referenced by the index provider, S&P Dow Jones Indices, effective 4 August 2020.
The swap agreement through which the fund obtains its investment exposure to the index has now been amended such that: if the price of any WTI crude oil futures contract referenced by the index falls below US$9.50 (price floor), at any time, then the swap will be terminated. This price anomaly has only occurred on one day (in April 2020) from 1990 to date.