
The Twelve Traits of Banking
2020 has been a challenging year for the banks but we believe there is now light at the end of the tunnel for the sector’s long term investors (so come, all ye faithful!).
We highlight in this note twelve banking qualities (with apologies to The Twelve Days of Christmas) that support our positive view of sector attractiveness as we head into 2021:
- 1x book value screams value;
- 2% underlying cost growth = cost discipline;
- 3% forecast GDP growth leading indicator of rising credit;
- 4% home loan repayment deferrals, and still falling;
- 5% dividend yield (7% grossed up) beats TD and cash rates;
- 6% leverage ratio stronger than ever;
- 7% commercial property EaD lowest in years;
- 8% deposit growth a handy funding source;
- 9% income growth for smaller regionals unbeatable;
- 10% underlying ROE on the mend;
- 11% CET1 ratio ahead of APRA minimum; and
- 12% pro-forma CET1 adds to capital management flexibility.
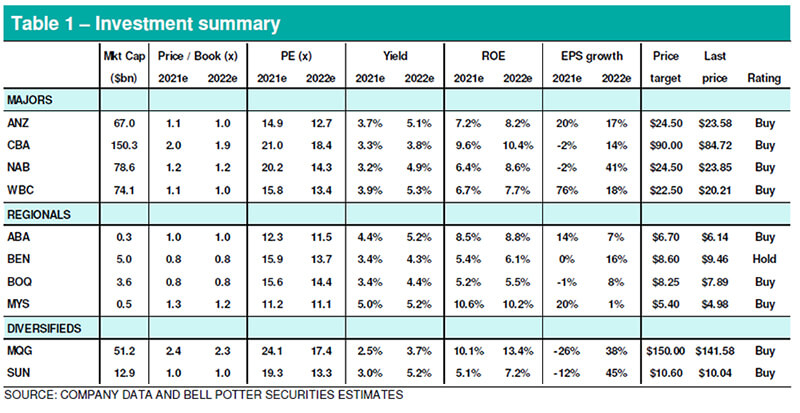
MQG remains our top sector pick. In terms of the majors, ANZ heads the list and this is followed by CBA, NAB and WBC. As for the regionals, we continue to like ABA, BOQ, MYS and SUN.
1X Book Value Screams Value
Our forecasts suggest that banks on average would continue to trade at close to book value in the foreseeable future, although skewed by higher multiples in better performers such as CBA and MQG (being the proverbial partridges in the pear tree). ROE is expected to improve over the next few years due to lower impairment charges and further cost discipline (despite higher capital levels) and we feel some catching up is only justified (based on the strong historical relationship between ROE and Price/Book multiple) for those stuck in this trading band (e.g. ANZ, NAB, WBC and all regionals). This makes for an attractive entry point into majors such as ANZ and WBC and regionals such as ABA, BEN, BOQ and SUN. In addition, we don’t see CBA’s higher multiple as an impediment given earnings quality and consistency that have been baked into the bank.
2% Underlying Cost Growth = Cost Discipline
The majors continue to have an advantage over the regionals in terms of operating scale. As indicated in Table 2 in the detailed report, underlying cost growth (i.e. excluding large notable items such as customer refunds, regulatory and compliance spend, etc.) was capped at up to 2% for the majors (in line with keeping this under CPI) while the regionals continue to incur higher spend in IT. Cost discipline appears more consistent across ANZ and CBA although NAB’s cost-out story should provide reasonable earnings upside in the medium term (note NAB’s superior costs as a percentage of average assets in Table 2). As for the regionals, SUN’s bank and smaller ones such as ABA and MYS continue to generate positive “Jaws”. The banks have largely capped underlying cost growth at 2% on a consistent basis.
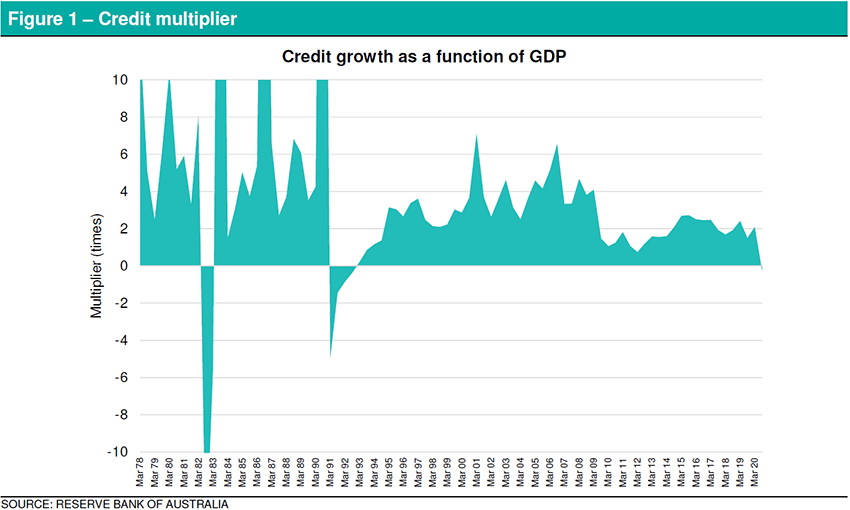
3% Forecast GDP Growth Leading Indicator of Rising Credit
While GDP for the 12 months to 30 September 2020 was negative, credit growth was a respectable 2%. Bloomberg consensus GDP growth in 2021 and 2022 is 3.2-3.4% and, all else being equal and assuming a credit growth multiplier of 2x, should translate into 6.4-6.8% credit growth. The rebound should benefit all banks (i.e. rising tide lifting all banks, being proxies for the economy), with the majors chasing system growth (i.e. managing for profitable growth) and the regionals (again, ABA and MYS) chasing >system growth.
4% Home Loan Repayment Deferrals, and Still Falling
Home loan repayment deferrals continue to improve, in terms of balances down from 7-12% at the end of September to 4% for the majors and from 6-12% to 3% for the regionals. We believe COVID-19 provisions are more than sufficient with the likelihood of write-backs and/or recoveries down the track, and ongoing improvements in this space was a key factor in APRA recent lifting of its dividend payout restriction.
5% Dividend Yield (7% Grossed Up) Beats TD and Cash Rates
Forecast dividend yields are expected to increase to around 5% (7% grossed up after franking) following APRA’s lifting of dividend payout restrictions and continue to be extremely attractive relative to term deposit and cash management account/trust rates. We estimate the current grossed-up rate differential is around +4% over average bank term deposits and average CMA/CMTs, and this is similar compared to cash, 90-day BBSW and 10-year Government Bond rates.
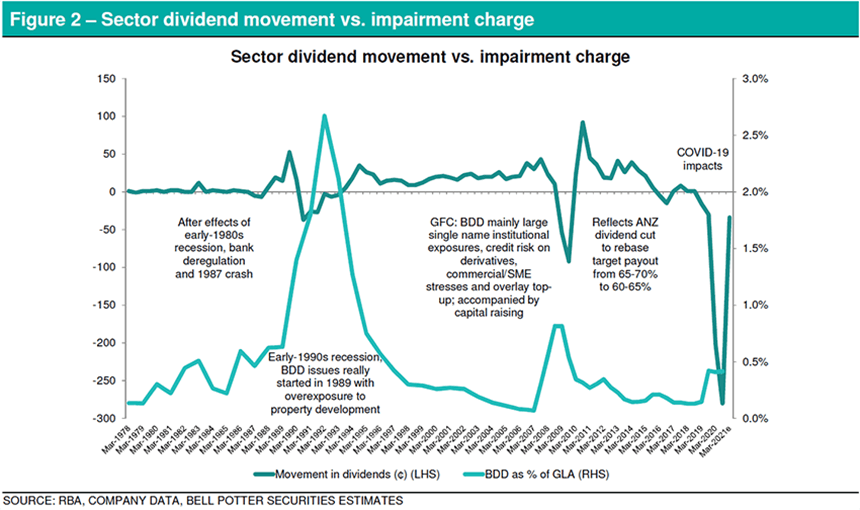
A sharp dividend rebound usually follows a financial crisis. Including COVID-19 impacts, bank dividends have gone backwards in only five periods in the past 40 years – with the other events being the 1987 stock market crash, the early-1990s recession, the GFC and some dividend reductions following APRA’s introduction of higher asset risk weights. We believe FY20’s COVID-19 related dividend reductions are more to do with regulators’ risk aversion than actual impairment charges – that are just provisions at this stage. Note that dividend reductions at the time of the early 1990s recession and the GFC are proportionately lower relative to the respective impairment charges. Given our view that COVID-19 provisions are surplus to requirements, any provision write-back or recovery is likely to find their way back to shareholders as special dividends.
6% Leverage Ratio Stronger Than Ever
This is a proxy for the sector’s equity ratio and provides a useful comparison across IRB and standardised ADIs by stripping away risk weighted impacts. The average leverage ratio has increased by nearly 2% (in absolute terms) to 6% since 2015 and is currently 2% over APRA’s 4% minimum requirement. This corresponds with a general improvement in balance leverage since the early 1990s (majors’ ratio taken as indicative of the sector).
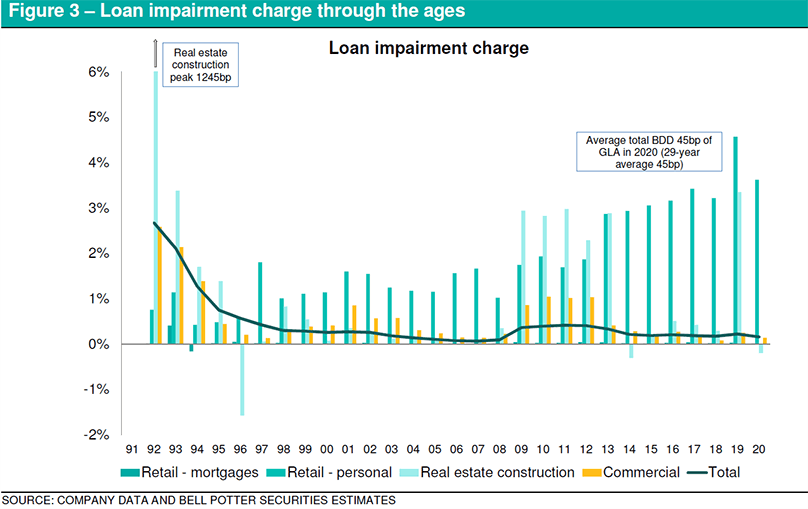
7% Commercial Property EAD Lowest in Years
Commercial property exposure has been the banks’ Achilles’ heel dating back to the early 1990s with an average loan loss charge of 133bp GLA (that compares with 3bp for mortgages and 58bp for commercial lending, and is only surpassed by 185bp in unsecured personal lending). The good news is that there has been much improvement in this exposure right across the sector, averaging 7% of EaD now compared with the highs in 2009-11 (10-12%). WBC, SUN’s bank and BEN have the lowest exposures in our view.
8% Deposit Growth a Handy Funding Source
Deposit growth for the banks in our coverage averaged 8% in FY20, partly due to flight to quality. This provided another cheap source of funding for loan growth and further improved Loan to Deposit ratio down to 1.2x. While excess liquidity from this could place downward pressure on NIM, we feel there is a net benefit on balance as lending growth reverts back to system growth. Smaller regionals such as ABA and MYS appear to be the biggest beneficiaries given their >system lending growth and reliance on wholesale funding – with a positive double whammy effect on NIM and NIE. We continue to prefer ABA and MYS among the standalone regional banks.
9% Income Growth for Smaller Regionals Unbeatable
Unconstrained by legacy issues (Royal Commission, etc.), the smaller regionals outperformed in this category averaging 9% operating income growth. This is largely due to above system lending growth, positive rate (i.e. NIM) and volume outcomes, stable noninterest income and absence of customer refunds impacting the top line. In a way, the smaller regionals’ top line growth more than compensated for higher operating expense growth due to IT and front office spend – resulting in positive “Jaws” of 3-4% that is much higher than those of its larger peers. Again, we favour ABA and MYS among the regionals. As for the larger ones, CBA and SUN’ would have better top line capability.
10% Underlying ROE On The Mind
Cash ROE may have been around 8% in FY20 but was closer to 10% on an underlying basis (and especially in 2H20) for the major banks. While this slightly exceeds the average cost of equity of around 9%, we see upside from here as the economy improves and capital efficiency kicks in (higher dividends following APRA’s lifting of dividend restrictions or deployment into higher return investments). Of the majors, CBA continues to have the best underlying ROE although we can see the rest of the pack – all else being equal – improving towards the 10-12% range in the long term. Of the regionals, ABA and MYS have the best underlying ROE.
11% CET1 Ahead of APRA Minimum
CET1 ratio has come a long way since the GFC with the sector average now at 11%. CBA and NAB top the majors at 11.8% and 11.5% respectively, while ABA and MYS top the regionals at 11.1% each. While these are already in excess of APRA’s proposed minimum requirements of 10.5% for D-SIB ADIs (i.e. majors), 9.5% for IRB ADIs and 8.0% for standardised ADIs (i.e. regionals), the plan for more differentiated mortgage risk weights by LVR bands would benefit NAB and WBC, BEN and MYS, and MQG and SUN’s bank.
Including reduced risk weights for small business lending, we estimate RWA will fall by 8% for IRB ADIs and by 12% for standardised ADIs. The outcomes are better for the latter (SUN’s bank, followed in order by BEN, MYS, BOQ and ABA). As for the others, MQG would have the best outcome, followed in order by WBC, NAB, CBA and ANZ. We also estimate CET1 ratio improvements of 60-103bp for the majors (WBC and NAB again better off), 135bp for MQG (best outcome of the lot) and 108-153bp for the regionals (in order, MYS, SUN, BEN, ABA and BOQ) – that are generally sufficient to absorb the proposed countercyclical buffer of 100bp.
12% Pro-Forma CET1 Adds to Capital Management Flexibility
For the majors, the average pro-forma CET1 ratio would be closer to 12% with CBA leading the pack at 12.4%, followed by NAB at 11.8%, ANZ at 11.4% and WBC at 11.3%. Net of APRA’s proposed risk weight changes, these would rise to 12.0-13.3% for the majors, and to 10.6-12.6% for the regionals. Relative to the proposed minimum requirements, surplus capital will likely underpin prospective dividend payments and capital initiatives. We attribute only a small likelihood of buybacks given APRA’s proposed capital rules and the fact that banks would want to take advantage of post-vaccine growth opportunities.